




Local hosting latency is the measurable delay in data transmission between a user’s device and a nearby hosting server, directly determining how fast a website responds. Understanding how local hosting latency works is not optional for web developers and IT professionals in 2026. It is the difference between a site that feels instant and one that quietly bleeds users. This guide breaks down the technical mechanics, measurement techniques, and practical strategies you need to control latency at every layer of your stack.
What technical factors determine local hosting latency?
Latency is cumulative. Every stage of a request adds delay, and propagation, routing, queuing, and app behaviour all contribute before a single byte reaches the browser. Placing a server locally reduces propagation delay, but it does not eliminate the other contributors.
Here are the core technical factors that shape local hosting latency:
- Propagation delay. Light travels through fibre at roughly two thirds of its speed in a vacuum. Every 100 kilometres between user and server adds approximately 0.5ms of one-way delay. Over a continent, that compounds fast.
- Routing and hop count. Each network hop through a router or switch adds queuing and processing time. Traffic that hairpins through a distant provider, even when the server is geographically close, can add tens of milliseconds of avoidable delay.
- Server processing time. A well-optimised server stack handles requests in 20–50ms. A legacy setup running untuned PHP or unindexed databases can push that to 400ms or more.
- Storage type. NVMe cache queries complete in 0.5–2ms, while mechanical HDD queries take 20–100ms each. A WordPress page typically runs 10–50 database queries, so slow storage multiplies across every page load.
- TLS and TCP handshake overhead. A full TLS 1.2 handshake adds two round trips before any content transfers. TLS 1.3 reduces this to one round trip, cutting handshake latency by roughly half.
- Jitter and packet loss. Jitter is the variation in latency between packets. A stable 180ms latency outperforms an unstable range of 40ms–900ms in operational terms because caches, autoscaling, and user experience all depend on consistency.
Pro Tip: Check your server’s BGP peering arrangements with your hosting provider. A server in Sydney routing traffic through Los Angeles before returning to Melbourne is a real and common problem that geographic proximity alone will not fix.
Local hosting vs cloud hosting: how do they compare?

The performance gap between local and remote hosting is not theoretical. Accessing servers across continents adds 80–200ms of network latency regardless of how powerful the hardware is. That ceiling is set by physics, not configuration.
The table below shows typical round-trip latency ranges based on server location relative to an Australian user base.
| Server Location | Typical Round-Trip Latency | Key Risk Factor |
|---|---|---|
| Local (Australian data centre) | 5–40ms | BGP peering quality |
| US East Coast | 180–220ms | Transcontinental routing |
| Europe (London, Frankfurt) | 250–320ms | Submarine cable congestion |
| Asia (Singapore, Tokyo) | 60–120ms | Regional peering variance |
Regional server placement can reduce response times by nearly 500ms and keep latency consistently below 150ms in well-optimised environments. That is not a marginal gain. For a transactional site or a client portal, it is the difference between a conversion and a bounce.
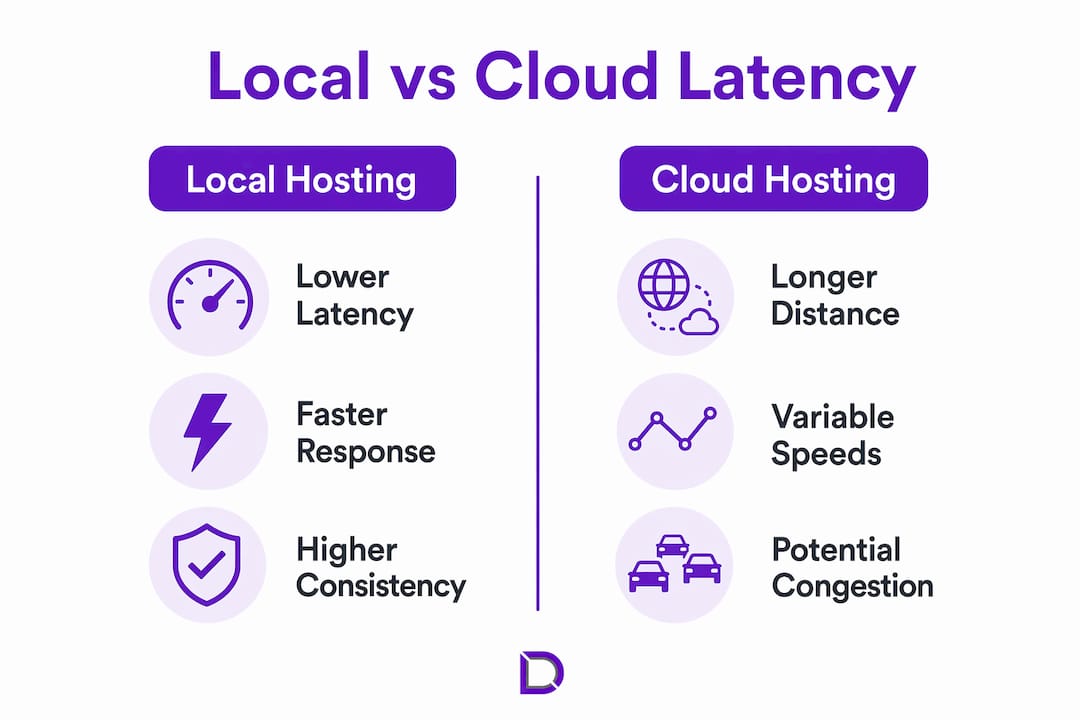
Remote hosting introduces two compounding problems beyond raw distance. First, network congestion on international links is unpredictable and outside your control. Second, routing inefficiencies mean your traffic may travel a suboptimal path even when a shorter physical route exists. Local hosting with good peering arrangements solves both.
Consistency matters as much as speed. Humans and applications tolerate consistent latency better than variable latency. Jitter corrupts the feel of interactive applications and breaks autoscaling logic that relies on stable response time baselines. A local server with steady 35ms responses beats a cloud instance swinging between 20ms and 300ms. The benefits of local Australian hosting extend well beyond raw millisecond counts when you factor in consistency and regulatory data residency requirements.
How to test hosting latency accurately
Measuring latency correctly is as important as reducing it. The wrong test setup produces misleading numbers and sends you chasing the wrong bottleneck.
The most useful metrics for local hosting latency analysis are:
- Time to First Byte (TTFB). TTFB captures network latency plus backend processing combined. Industry standards expect server response times under 200ms as a baseline. A high TTFB points to either network path problems or server-side processing delays, and you need to isolate which one before acting.
- P50, P95, and P99 latency percentiles. Averages hide the worst user experiences. P95 and P99 latency metrics reveal service reliability problems that averages mask entirely. If your P99 is 800ms while your P50 is 40ms, roughly one in a hundred requests is failing your users badly.
- Jitter measurement. Run repeated ping or HTTP request sequences and calculate the standard deviation of response times. High jitter with acceptable average latency is a network quality problem, not a server problem.
- Packet loss rate. Even 0.1% packet loss forces TCP retransmissions that spike perceived latency by hundreds of milliseconds.
For LAN and local network testing, LibreSpeed is the standard self-hosted tool. Testing setups can impose bottlenecks, and running LibreSpeed in Docker without host networking mode will under-report true LAN speeds. Use Docker host mode to bypass container network overhead and get accurate baseline measurements.
Pro Tip: Use server timing headers in your HTTP responses during development. They expose exactly how long the server spent on database queries, cache lookups, and rendering, letting you pinpoint processing delays without guessing.
Synthetic monitoring tools like Pingdom and Datadog Synthetics run scheduled tests from fixed locations and catch regressions before users do. Real User Monitoring (RUM) tools like New Relic Browser or Cloudflare Web Analytics capture actual user latency across diverse network conditions. Use both. Synthetic tests give you control; RUM gives you truth.
What practical steps reduce local hosting latency?
Reducing latency requires addressing every layer of the stack. Hardware upgrades alone will not fix a routing problem, and network optimisation will not compensate for a slow application layer. High TTFB is often caused by TLS overhead, routing inefficiencies, or network congestion rather than raw CPU power. Work through each layer systematically.
- Choose hosting geographically close to your user base. For Australian audiences, this means Australian data centres. Do not assume a Singapore server is close enough. The latency difference between Sydney and Singapore is measurable and consistent.
- Upgrade to NVMe storage. Moving from HDD to NVMe cuts database query latency from 20–100ms per query down to 0.5–2ms. For a WordPress site running 30 queries per page, that is a potential saving of over 2,900ms in storage-related delay alone.
- Tune your server software stack. Enable PHP OPcache to eliminate repeated script compilation overhead. Configure PHP-FPM pool sizes to match your actual traffic patterns. Add a caching layer such as Redis or Memcached to serve repeated queries from memory rather than disk.
- Minimise TLS handshake overhead. Use TLS 1.3 wherever possible. Enable session resumption and OCSP stapling to reduce the round trips required for secure connections. These are configuration changes, not infrastructure purchases.
- Audit your network peering. Ask your hosting provider which upstream providers they peer with and whether they have direct peering with major Australian ISPs. Poor peering is a hidden latency source that no amount of server tuning will fix.
- Use a CDN for static assets. A Content Delivery Network like Cloudflare or Fastly serves images, scripts, and stylesheets from edge nodes close to users. This does not replace local hosting for dynamic content, but it removes static asset delivery from your origin server’s latency budget entirely.
For teams managing scalable hosting architectures, load balancer configuration also matters. A poorly configured load balancer adds its own processing delay and can introduce jitter by distributing requests unevenly across backend instances.
Key takeaways
Local hosting latency is determined by propagation delay, routing quality, server processing time, and storage speed, and reducing it requires addressing all four layers simultaneously.
| Point | Details |
|---|---|
| Latency is cumulative | Network hops, storage speed, and TLS overhead all add delay on top of physical distance. |
| Consistency beats raw speed | A stable 180ms latency outperforms an unstable 40ms–900ms range for user experience and autoscaling. |
| NVMe storage is high impact | Switching from HDD to NVMe cuts per-query latency from up to 100ms down to 2ms or less. |
| Test with the right tools | Use LibreSpeed in Docker host mode and P95/P99 percentiles to reveal true latency performance. |
| Peering quality matters | A local server with poor BGP peering can underperform a well-connected regional server. |
The metric developers keep ignoring
Most developers I work with focus on average response time and call it done. That is the wrong metric. Average latency is the number that makes your hosting dashboard look good. P99 latency is the number that tells you what your worst users actually experience.
I have seen production WordPress sites with a P50 TTFB of 45ms and a P99 of 1,200ms. The average looked fine. The support queue told a different story. The culprit was not the server hardware or the geographic location. It was a combination of unindexed database tables and a misconfigured PHP-FPM pool that exhausted workers under moderate load, leaving requests queued.
The uncomfortable truth about local hosting latency is that most latency problems are not solved by moving servers closer. They are solved by understanding what is actually happening at each layer of the stack. Propagation delay is the easy part to reason about. Routing inefficiencies, jitter from congested upstream links, and tail latency from application-layer bottlenecks are where the real work is.
My advice: instrument everything before you change anything. Deploy server timing headers, set up RUM, and pull P95 and P99 data for at least two weeks before drawing conclusions. You will almost always find the bottleneck is not where you assumed it was. Upgrading to a faster server in the same location often does nothing if the problem is a BGP routing loop or a slow database query running on every page load.
Stable, predictable latency is the goal. Not the lowest possible number on a good day.
— James
How Com can help you cut hosting latency
If you have worked through this guide and realised your current hosting setup is the problem, Com offers Australian web hosting built for performance from the ground up. Servers are located in Australian data centres, which means your users get the propagation delay advantage without relying on international routing.

Com’s hosting infrastructure uses NVMe storage as standard, which directly addresses one of the most impactful latency contributors for database-driven sites. Managed hosting plans include configuration support for PHP-FPM tuning, caching layers, and TLS optimisation. If you are building or migrating a site and want local latency working in your favour from day one, explore Com’s hosting plans and speak with the local support team about your specific performance requirements.
FAQ
What is local hosting latency?
Local hosting latency is the round-trip delay between a user’s device and a nearby hosting server, measured in milliseconds. It includes propagation delay, routing overhead, server processing time, and storage access time.
What is a good TTFB for a locally hosted site?
Industry standards set the baseline at under 200ms for server response time. A well-optimised local server typically delivers TTFB in the 20–80ms range for Australian users accessing an Australian-hosted site.
Why does my local server still feel slow?
A local server can still produce high latency if BGP peering is suboptimal, storage is HDD-based, or the application layer has unindexed queries or misconfigured worker pools. Geographic proximity reduces propagation delay but does not fix routing or application bottlenecks.
How do p95 and p99 latency metrics differ from average latency?
P95 latency is the response time that 95% of requests complete within. P99 captures the slowest 1% of requests. Averages hide these tail latency spikes, which are the requests most likely to generate user complaints and support tickets.
What tool should i use to test local network latency?
LibreSpeed is the standard self-hosted tool for LAN and local network latency testing. Run it using Docker host networking mode to avoid container overhead skewing your results toward artificially higher latency readings.
Leave a Reply